What Is the CNN Fear & Greed Index? Crypto Version Differences and How to Read It
When the market crashes, you want to sell; when it soars, you want to chase. This impulse is exactly what the "Fear & Greed Index" tries to quantify. It uses a single number from 0 to 100 to tell you whether the market is leaning toward fear or greed.
The "fear and greed index" you see in the news or the Hotcoin Crypto Daily actually has two main versions: the CNN US stock version and a Bitcoin-centric crypto version. The names are similar, but their calculation methods and the markets they reflect are completely different.
Key Takeaways
- The Fear & Greed Index is a 0–100 sentiment indicator: the lower the number, the more fear; the higher, the more greed.
- The CNN version measures US stocks and is an equal-weighted average of 7 stock and bond market indicators.
- The crypto version is Bitcoin-centric and incorporates volatility, volume, social media heat, BTC dominance, and Google search trends.
- The index is best used as a "thermometer" and risk reminder, not as a standalone buy or sell signal.
What Is the Fear & Greed Index?
The Fear & Greed Index combines multiple market data points into a 0–100 score to measure investors' overall current sentiment. The idea behind it is simple: excessive fear drives prices too low, and excessive greed drives prices too high.
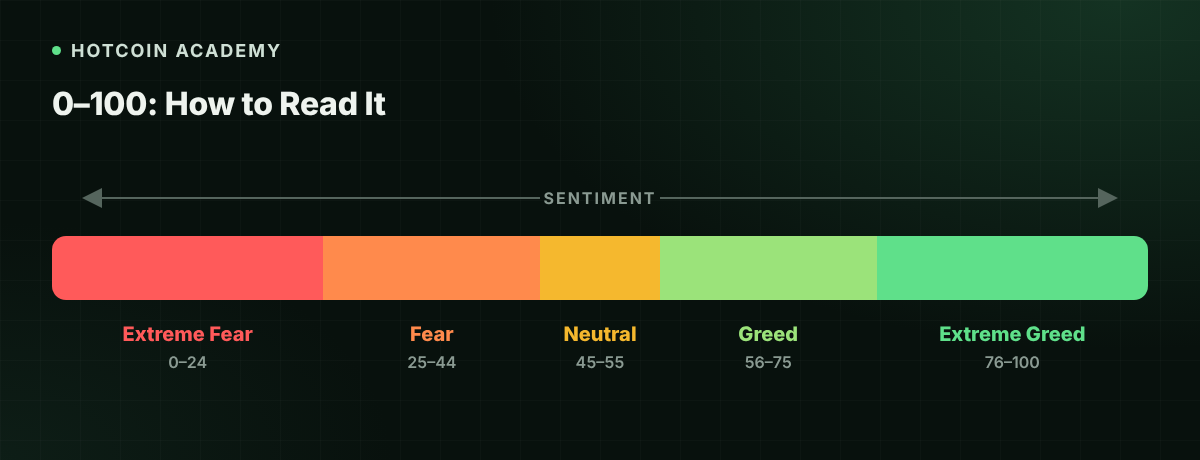
Taking the CNN version as an example, the common ranges are divided as follows:
| Value | Category | Typical Market State |
|---|---|---|
| 0–24 | Extreme Fear | Sharp declines, panic selling, capital fleeing to safe-haven assets |
| 25–44 | Fear | Lack of confidence, rallies often met with selling pressure |
| 45–55 | Neutral | Bulls and bears tug-of-war, waiting for direction |
| 56–75 | Greed | Increased willingness to chase prices, higher risk appetite |
| 76–100 | Extreme Greed | Overheating, FOMO, gains may have already priced in |
The range boundaries vary slightly among providers, and the grading of the crypto version is not entirely consistent across publishers. Always refer to the actual markings on the publishing website.
CNN Fear & Greed Index: 7 Indicators
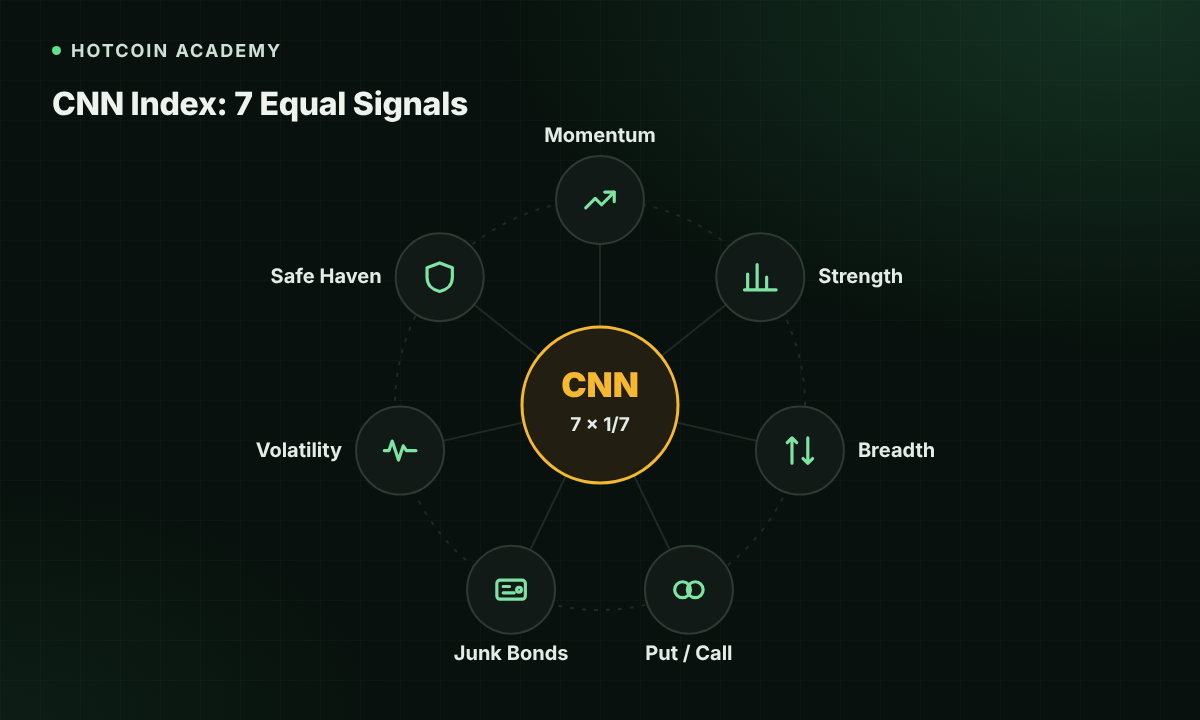
The CNN Fear & Greed Index is an equal-weighted average of 7 US stock and bond market indicators, updated every trading day. Each indicator is compared against its own historical level to determine whether it currently leans toward fear or greed.
| Indicator | What It Looks At | Greed-Leaning Condition |
|---|---|---|
| Stock Price Momentum | Distance between the S&P 500 and its 125-day moving average | Index significantly above the moving average |
| Stock Price Strength | Number of stocks hitting 52-week highs vs. lows on the NYSE | More stocks hitting new highs |
| Stock Price Breadth | Volume comparison of advancing vs. declining stocks | Higher volume in advancing stocks |
| Put and Call Options | 5-day average of the Put/Call Ratio | Ratio is low, little hedging demand |
| Junk Bond Demand | Yield spread between junk bonds and investment-grade bonds | Spread narrows, willingness to take credit risk |
| Market Volatility | VIX volatility index and its 50-day moving average | VIX is low |
| Safe Haven Demand | Return difference between stocks and US Treasuries over the past 20 trading days | Stock returns outperform Treasuries |
Historically, the CNN Index dropped to single digits during the 2008 financial crisis and the March 2020 pandemic crash. Both times later became long-term lows, but no one knew where the bottom was at the time.
How Is the Crypto Fear & Greed Index Calculated?
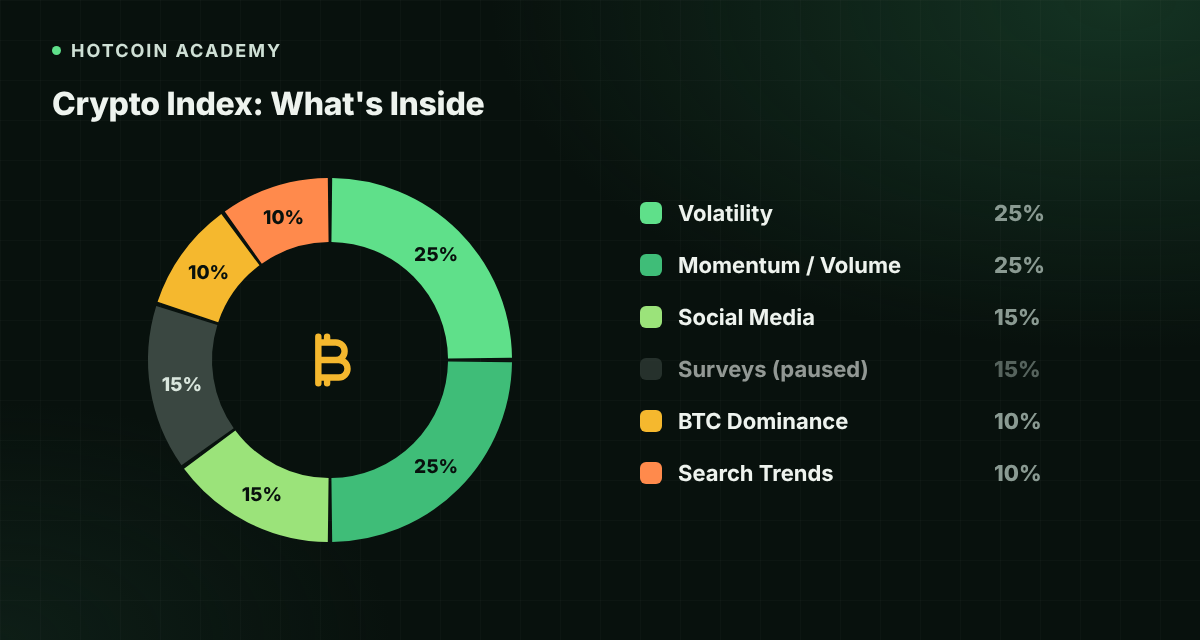
The most widely cited crypto version is Alternative.me's Crypto Fear & Greed Index, which is Bitcoin-centric and updated once daily. The fear and greed index in the Hotcoin Crypto Daily also uses this source. It is weighted from 6 aspects:
| Component | Weight | What It Looks At |
|---|---|---|
| Volatility | 25% | BTC's current volatility and maximum drawdown compared to 30-day and 90-day averages; abnormal volatility expansion is considered fear |
| Market Momentum / Volume | 25% | BTC volume and momentum; high volume during rallies is considered greed |
| Social Media | 15% | Interaction speed and volume of BTC-related hashtags on X (formerly Twitter) |
| Surveys | 15% | Weekly community polls; currently paused |
| BTC Dominance | 10% | BTC's market cap as a percentage of total crypto market cap; rising dominance usually indicates capital seeking safety away from altcoins |
| Search Trends | 10% | Search changes for Bitcoin-related keywords on Google Trends |
CoinMarketCap also launched its own version in 2023. It looks at the price momentum of the top 10 tokens by market cap (excluding stablecoins), implied volatility of BTC and ETH, put/call ratios, stablecoin supply ratio, and the platform's own search and user interaction data. The numbers from the two crypto versions may differ on the same day, so cite the source when referencing them.
CNN Version vs Crypto Version: What's the Difference?
The biggest difference is what they measure: the CNN version looks at US stocks and bonds, while the crypto version looks at Bitcoin and crypto market sentiment.
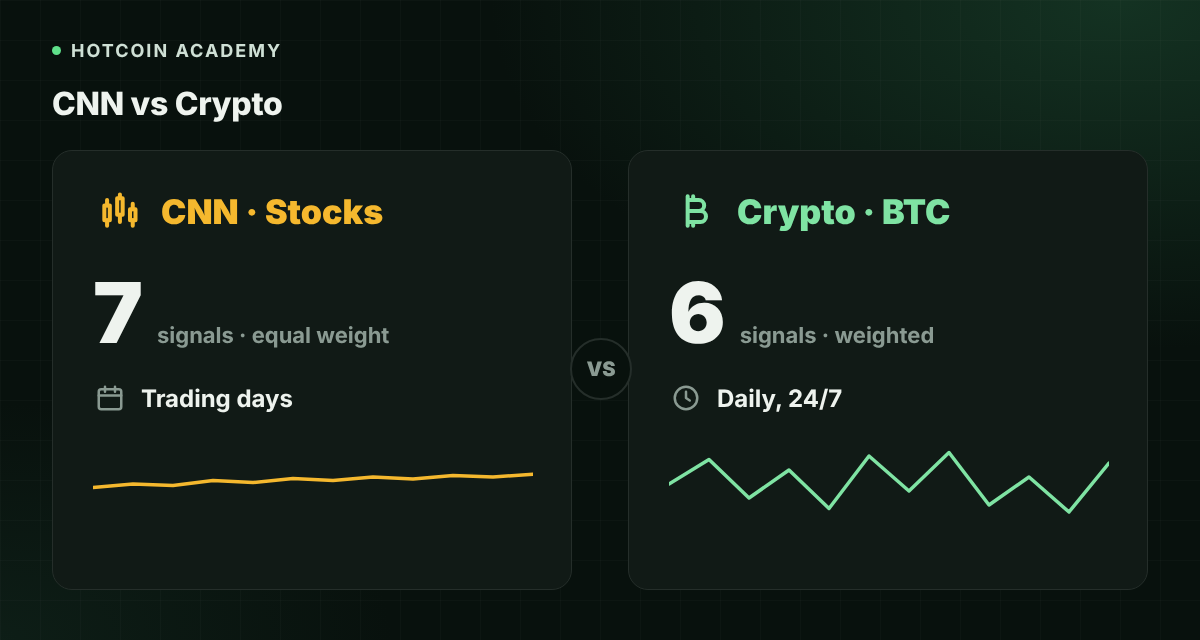
| Comparison Item | CNN Fear & Greed Index | Crypto Fear & Greed Index (Alternative.me) |
|---|---|---|
| Market Measured | US stock market | Cryptocurrency (primarily BTC) |
| Number of Indicators | 7, equal weight | 6, weights 10%–25% |
| Data Types | Price, volume, options, bond spreads, VIX | Price volatility, volume, social media heat, search trends, BTC dominance |
| Update Frequency | Updated on trading days | Updated daily, including weekends |
| Volatility Characteristics | Relatively stable | More volatile; jumping from extreme greed to fear within days is not uncommon |
| Suitable For | US stock, US stock token, and TradFi investors | Spot and contract crypto traders |
The two indices often move in the same direction because Bitcoin and US stocks (especially tech stocks) are both affected by interest rates, the dollar, and risk appetite. When they diverge—for example, US stocks show greed while crypto shows fear—it often means the crypto market has its own issues, such as large-scale liquidations or regulatory events.
How to Read and Use the Fear & Greed Index?
The most practical approach is to "look at extremes, look at changes, and combine with other indicators," rather than buying or selling based on a single number.
- Look at Extreme Values, Not Middle Values: Changes between 40–60 carry limited information. It is only when the index enters extreme fear or extreme greed that it is worth re-examining positions and risk.
- Look at Direction and Cycle: Single-day numbers are easily disturbed by events. Observing the 7-day or 30-day trend better indicates whether sentiment is heating up or cooling down.
- Think Contrarian, But Be Patient: Buffett's "Be fearful when others are greedy, and greedy when others are fearful" is the spirit of this index. However, extreme fear can last for weeks, and prices may continue to fall.
- Combine with Other Data: For the crypto market, also observe funding rates, contract open interest, liquidation amounts, and spot ETF flows. For example, if the index is in extreme greed and funding rates are also high, it indicates crowded leveraged long positions.
- Use as a Risk Reminder, Not an Entry Signal: When the index is high, consider reducing leverage or setting stop-losses; when low, consider dollar-cost averaging in batches rather than going all-in at once.
Common Misconceptions
- "An index below 20 means it's the bottom": The index only reflects sentiment and cannot predict when prices will reverse.
- Using the CNN version to judge crypto: US stock sentiment is only a reference; crypto should look at the crypto version.
- Forgetting altcoin differences: The crypto version is BTC-centric, and individual altcoin trends may be completely different.
FAQ
Q1: Where can I check the Fear & Greed Index? The CNN version is on CNN Business's Fear & Greed page; the crypto version can be found on Alternative.me or CoinMarketCap. The Hotcoin Crypto Daily also lists the daily crypto fear and greed index.
Q2: How often is the CNN Fear & Greed Index updated? It updates with US stock trading days and remains unchanged on weekends and US market holidays. The crypto version updates daily, including weekends.
Q3: Can I buy the dip when the index is in extreme fear? Extreme fear represents market pessimism, and historically some lows have occurred in this range, but the index cannot tell you where the bottom is. If you want to position, entering in batches and controlling leverage is safer than going all-in at once.
Q4: Why do crypto fear and greed index numbers differ across websites? Different publishers use different data and weights. Alternative.me is BTC-centric; CoinMarketCap includes top 10 tokens and derivatives data.
Q5: Is the Fear & Greed Index accurate? It reflects "current sentiment," not predictions. It is useful for reminding yourself whether you are being too impulsive, but unreliable for predicting tomorrow's price movements.
Conclusion
The Fear & Greed Index is a market sentiment thermometer. For trading US stocks, look at the CNN version; for trading cryptocurrencies, look at the crypto version. Using it together with funding rates, ETF flows, and your own risk control rules is far more useful than looking at a single number.
To keep track of the fear and greed index and BTC spot ETF flows daily, you can read the Hotcoin Crypto Daily Market Report.
Risk Warning: This article is for educational and informational purposes only and does not constitute any investment advice. Crypto assets and US stocks are highly volatile, and leveraged and contract trading may result in the loss of all principal. Please make decisions based on your own risk tolerance and consult a professional advisor when necessary.
Recommended
View more