How to Read MACD: Crossovers, Divergence, and Crypto Practice Explained
You buy on an MACD golden cross, and the price keeps falling. You sell when the histogram bars shrink, and the market makes a new high. In many cases, the software is not calculating anything wrong; the mistake is treating a change in momentum as a price reversal.
MACD is a common trend momentum indicator on trading charts. It helps you observe how upward or downward force changes, but it cannot guarantee in advance the direction of the next candle. Read the lines and histogram first, then talk about crossovers and divergence, and you are less likely to be led away by a single signal.
Key Takeaways
- MACD uses the difference between fast and slow moving averages to observe trend direction and price momentum.
- The common setting is 12, 26, 9; the period unit follows the chart and is not always "days."
- Crossovers, zero line position, and divergence answer different questions and need to be read together.
- Ranging markets tend to produce repeated crossovers, and signals on an unclosed candle may disappear.
What Is MACD
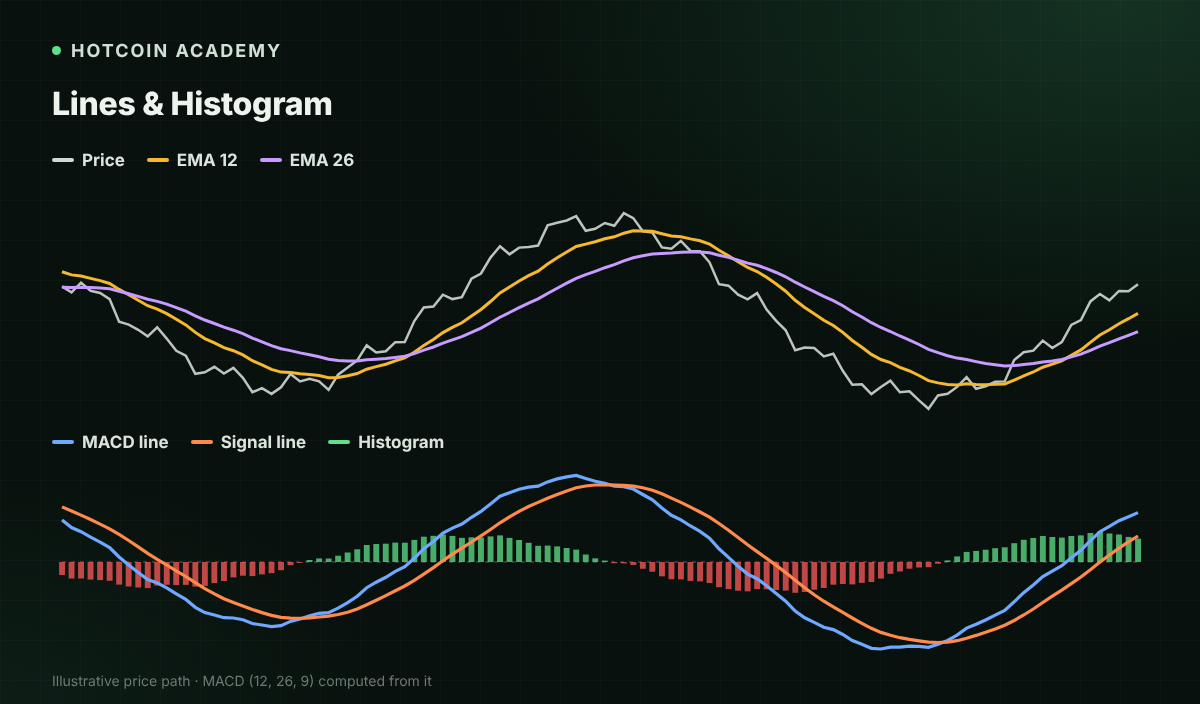
The English name of MACD is Moving Average Convergence Divergence. A common version first calculates the difference between the short-term and long-term exponential moving averages (EMA), then smooths that difference, and finally uses a histogram to show the distance between the two lines.
| Component | Common calculation | Main focus |
|---|---|---|
| MACD line | EMA 12 − EMA 26 | Relative position of fast and slow moving averages |
| Signal line | 9-period EMA of the MACD line | Smoothed change of MACD |
| Histogram | MACD line − Signal line | Difference between the two lines |
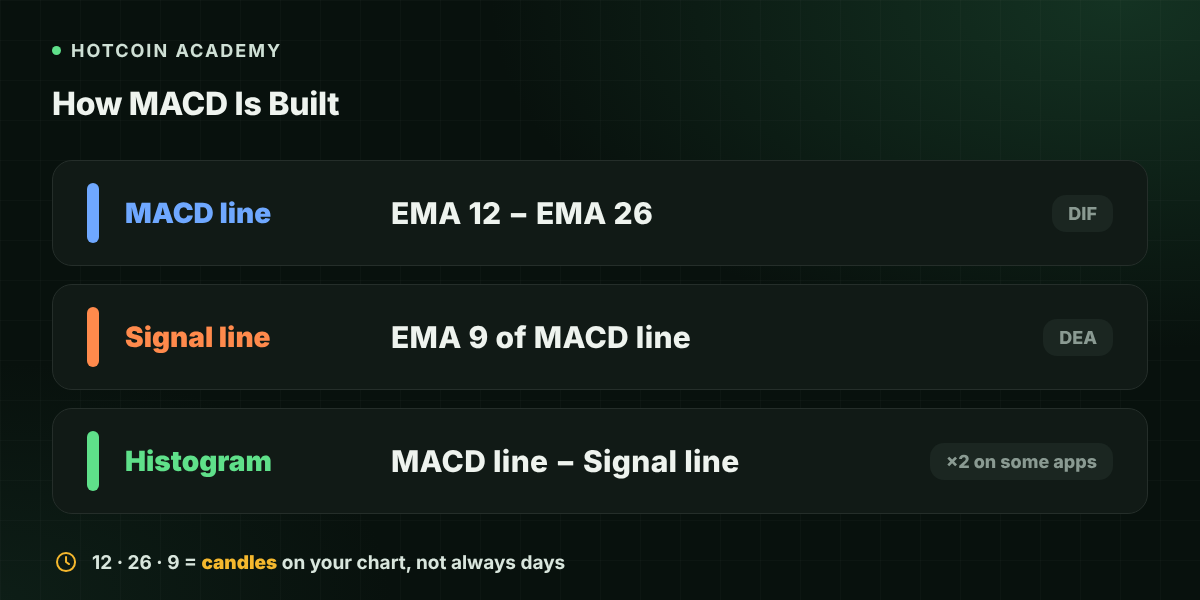
Some Chinese-language platforms call the MACD line DIF and the signal line DEA, and multiply the histogram value by 2. This display difference does not change crossover positions, but it does affect the numerical size of the bars. Check the platform definition before reading a screenshot, and do not judge only by name or color.
What Do the 12 26 9 Settings Mean
On a daily chart, 12 and 26 mean 12 and 26 daily candles; switch to a four-hour chart and they correspond to four-hour candles. 9 is the period for smoothing the MACD line, not an extra observation of 9 days of price.
Shortening the settings makes the indicator react faster but also adds noise; lengthening them makes it smoother but also more lagging. No single setting suits every coin and market condition. Beginners can fix the common settings first and learn how the same setting behaves in trends and ranges.
How to Read MACD Crossovers and the Zero Line
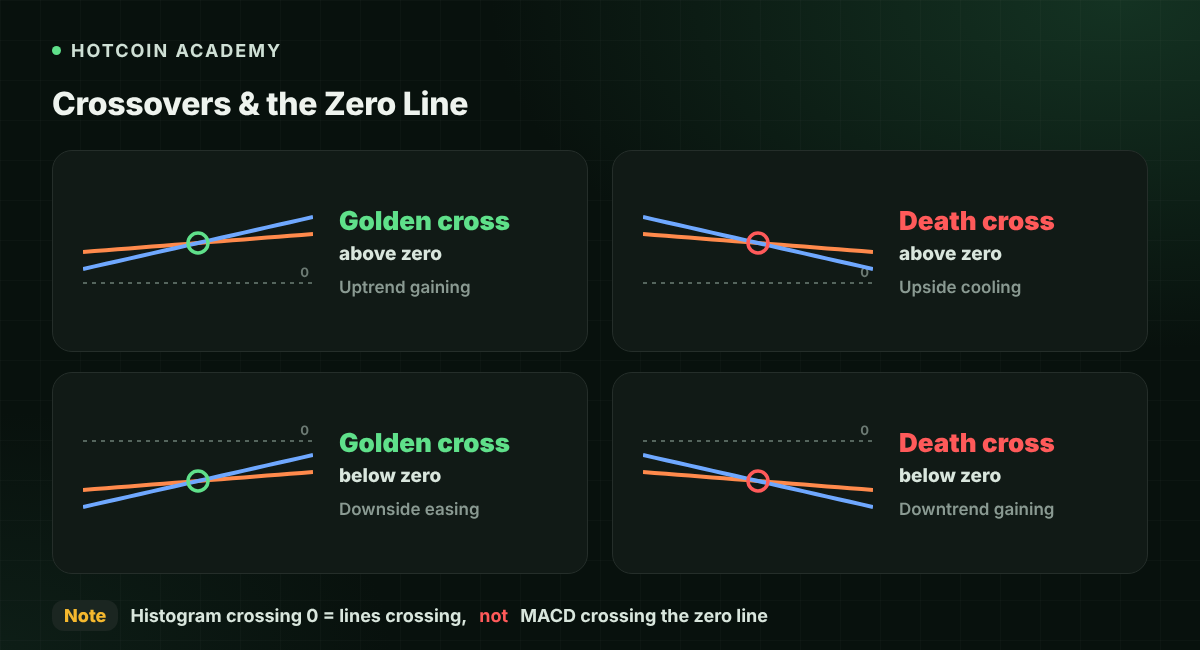
The MACD line crossing above the signal line is usually called a golden cross, meaning the difference between the two lines turns from negative to positive. It may correspond to weakening downside momentum or strengthening upside momentum, depending on the position.
The MACD line crossing below the signal line is usually called a death cross. It suggests relative momentum is weakening, but price does not necessarily turn down immediately.
The MACD line above the zero line means the short-term EMA is above the long-term EMA; below the zero line is the opposite. Note that the histogram crossing zero means the MACD line and signal line have crossed, not that the MACD line has crossed the zero line.
| Observation | What it can mean | What it does not directly imply |
|---|---|---|
| Golden cross below zero | Relative momentum improving within a decline | A larger-degree trend has reversed |
| Golden cross above zero | Momentum improving within an uptrend structure | Chasing the high will surely profit |
| Positive bars shrinking | The gap between MACD and signal narrows | The next candle must fall |
| Negative bars shrinking | The negative gap narrows | The decline is over |
What Does MACD Divergence Mean
A common bearish divergence is when price makes a higher high while the corresponding MACD high does not rise in sync; bullish divergence is when price makes a lower low while the corresponding MACD low does not move lower in sync.
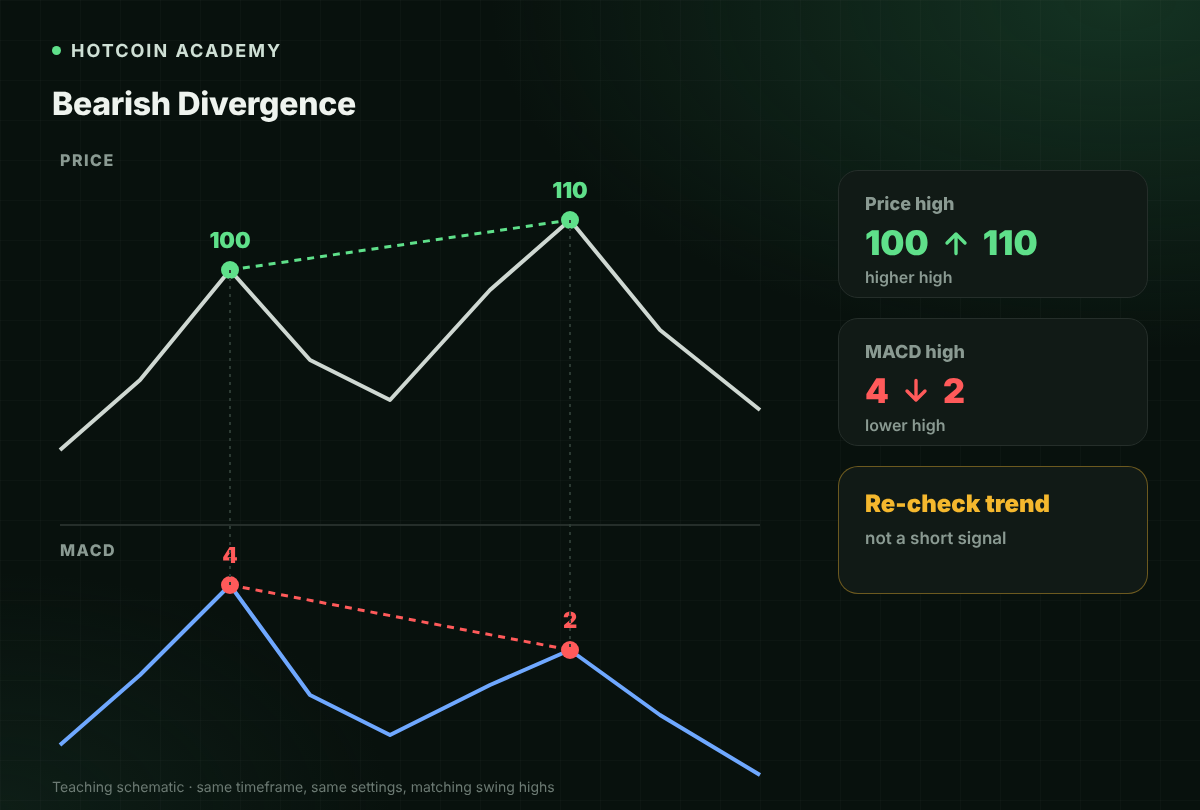
For example, a coin's two rebound highs rise from 100 to 110, while the corresponding MACD highs fall from 4 to 2. This shows that the new high is not supported by momentum of the same strength. It is a reason to re-check the trend, not an instruction to short immediately. In strong trends, divergence may appear repeatedly while price keeps running in the original direction.
When comparing divergence, use the same chart timeframe, the same settings, and corresponding swing highs and lows. Do not force a minor fluctuation together with a high from long ago, and do not switch casually between the MACD line and the histogram for comparison.
How to Use MACD in Crypto Markets
The following is an educational observation routine, not a return-verified trading strategy. Suppose you are looking at a BTC four-hour chart:
- Look at price structure first. Judge whether the market is making consistently higher lows or oscillating around a range. Repeated crossovers inside a range usually have lower reference value.
- Then look at the crossover position. A golden cross below the zero line and one above the zero line sit in different trend backgrounds.
- Wait for the relevant candle to close. An intraday pullback may make a newly formed crossover disappear.
- Check key levels and volume. If the indicator strengthens but price does not break resistance, it may still be only a rebound within the range.
- Define the invalidation point first. If price later falls back below the observed range, reassess rather than only waiting for the next crossover.
When switching to low-liquidity tokens, also consider wicks and slippage. A crossover visible on the chart does not mean an actual order can fill at that price.

Common Misconceptions
- "Red bars mean up and green bars mean down." Platform color schemes differ; read the positive and negative values and settings first.
- "If multiple timeframes show a golden cross at the same time, there is no risk." Multiple timeframes still come from related historical prices and cannot eliminate losses.
- "Divergence can accurately catch tops and bottoms." Divergence signals inconsistent momentum; whether a reversal occurs still needs later price confirmation.
FAQ
Q1: Is MACD a leading or lagging indicator? It is calculated from historical prices and smoothing, so it lags. Divergence may appear early, but that does not mean it can reliably predict the timing of a reversal.
Q2: What are the best MACD settings? There is no universally optimal setting. After adjusting, test across different market states and include fees and slippage, rather than picking only the combination with the best historical performance.
Q3: Should I sell when the histogram bars shrink? You cannot decide on this alone. Shrinking positive bars may only mean the pace of the rise is slowing, and price may still continue to rise.
Q4: Can MACD be used for Bitcoin short-term trading? It can be used for observation, but short-period noise and trading costs are more prominent, and the indicator itself does not provide a guarantee of stable returns.
Q5: Is an MACD golden cross the same as a moving average golden cross? No. The former usually refers to the MACD line crossing the signal line, while the latter usually refers to two price moving averages crossing.
Conclusion
The most valuable lesson from MACD is not "trade on every cross," but reading crossovers, the zero line, and price structure on the same chart. It can explain how momentum changes; it cannot replace risk control.
Risk warning: This article is for educational and informational purposes only and does not constitute investment advice. Technical indicators can fail, crypto assets are highly volatile, and using leverage can lead to rapid losses or forced liquidation.
Recommended
View more